- 01.Why "AI Cost per Output" must appear on every PRD from Day 1, not Day 180 — and what changes in the spec when it does
- 02.The data-prep tax: data preparation accounts for 20–40% of total AI initiative cost, and most teams under-budget by half
- 03.How DeepSeek V3.2 at $0.14/M tokens reframes the cost case for many use cases — and the model-routing pattern that makes the savings real
- 04.The unit economics gates that turn "we'll figure out cost later" into "we know the cost target before we ship"
- 05.The CFO conversation that turns cost discipline into a pricing-team artifact, not just an engineering chore
The story
Consider a product team that ships an AI feature with a clean PRD: user persona, success criteria, eval suite, GTM plan, launch timeline. The feature ships. Three months later, the CFO asks: "What's the cost per completed job on this feature?" The PM doesn't have the answer. Cost wasn't on the PRD. The team estimated infrastructure spend in aggregate, but never instrumented per-outcome attribution. Now the team has to reconstruct the cost from invoice data, allocation guesses, and engineering estimates. The number that comes back is 18× higher than the implicit assumption built into the GTM model. The pricing team has to redesign the offering. Sales has to re-position the value prop. The launch was successful. The economics weren't measured. The reconstruction takes a quarter and damages the credibility of the AI roadmap.
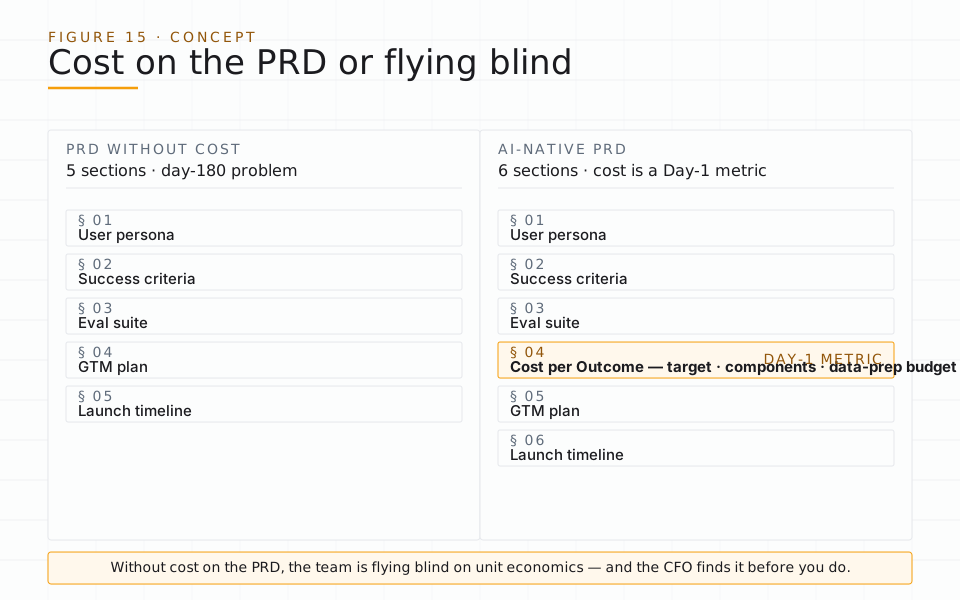
This is the Day-180 problem. Cost wasn't a Day-1 metric on the PRD, so cost wasn't instrumented in production, so the team had no defensible number when the CFO asked. The fix is structural: AI Cost per Output is a Day-1 metric on every AI PRD. Without it, the PRD is incomplete.
Consider a second team that does instrument cost from Day 1 but under-budgets the data-prep work. The build estimates assume off-the-shelf data is sufficient. Three weeks in, the team discovers the data needs cleaning, deduplication, sensitive-information scrubbing, schema normalization, label correction, and ongoing freshness maintenance. The data-prep work consumes 35% of total project time. The PRD didn't budget for it. The team falls behind schedule. The original launch date slips by two months.
The data-prep tax is not optional and not small. Industry research consistently puts it at 20–40% of total AI project cost. PRDs that skip the data-prep budget produce schedule slips and scope cuts that compound for the life of the initiative.
Consider a third team that reads this chapter and adopts cost-per-completed-job targets on every PRD from Day 1. Their first AI feature ships with a target: cost per resolved support ticket ≤ $0.30. The team instruments cost from launch. Week 1, cost per ticket is $0.85 (P50) and $4.20 (P90). The team is failing the target. They run the model-routing pattern: route easy tickets (the 70% with simple structure) to DeepSeek V3.2 at $0.14/M tokens; reserve the frontier model for the 30% that need it. Cost per ticket drops to $0.32 (P50) and $1.10 (P90). Still over target on P90. They add semantic caching for the 40% of tickets that share template structure. P90 drops to $0.45. Within 6 weeks, the cost target is met across the distribution. The discipline of Day-1 cost target plus continuous instrumented response is what hit the goal. Without the Day-1 target, the team would have shipped at $4/ticket and discovered the problem in the next CFO review.
The core idea
AI products break SaaS PM training in one specific way: SaaS PM treats cost as engineering's concern. AI PM treats cost as a product metric, on the PRD, from Day 1.
Day-1 unit economics is the discipline of including cost-per-completed-job targets on every AI PRD before engineering work begins, instrumenting cost attribution from launch, and treating cost as a product metric (not an engineering chore). The metric is AI Cost per Output — total cost (model + retrieval + tools + judges + infrastructure + data prep amortization) divided by the number of successful outcomes the feature produces. The discipline pairs this metric with engagement on every dashboard so the team can see the relationship between usage growth and unit-economics health.
The definitionA restaurant that opens without knowing its food cost percentage. Revenue grows. Customer praise comes in. The owner is delighted. Six months later, the accountant tells them they've been losing $2 on every entrée — the food cost was 65% of revenue when industry standard is 30%. The fix isn't sales. The fix is measuring food cost on every plate from Day 1 and making menu decisions with that number on the table. Same logic applies to AI PRDs: cost per completed job is the food-cost percentage of AI products. Skip it, and you're flying blind on the metric that determines whether the business works.
Think of it like:The concept — visualized
What goes on the PRD
Every AI PRD includes, at minimum:
- The cost-per-completed-job target. A specific number, with a P50 and P90 commitment. Example: "P50 cost per resolved ticket ≤ $0.30; P90 ≤ $1.00."
- The cost components. Model inference, retrieval calls, tool calls, judge calls, infrastructure (storage, compute, observability), data-prep amortization. Each line projected at launch and at 6-month volume.
- The data-prep budget. A specific allocation (typically 20–40% of project) for data cleaning, deduplication, sensitive-info scrubbing, schema normalization, ongoing freshness. Treated as engineering work, not "we'll figure it out."
- The cost-instrumentation plan. How will cost per completed job be measured in production? Which traces? Which dashboards? Who reviews?
- The cost-response triggers. What happens if cost per completed job exceeds target by 25%? By 50%? Predefined responses (model routing, harness optimization, pricing redesign) so the team doesn't improvise under pressure.
Add a cost contract to every AI PRD:
- Which job is being completed?
- What are expected and peak volumes?
- Which model and fallback will be used?
- How much context does a typical job require?
- How many retries and tool loops are allowed?
- How often will a person review or complete the job?
- What is cost per completed job at light, typical, and heavy use?
- What happens when the budget is exceeded: stop, queue, use a cheaper path, or ask a person?
- Which team owns the spend?
The stop condition matters most. A system allowed to keep trying has an open-ended cost. If the PRD does not decide when the loop ends, the implementation will decide by accident.
Budget heavy users separately. In many AI products, a small number of workflows generate most of the cost, and the average hides them.
Reject a PRD that contains quality criteria but no cost range and no overrun behaviour.
A PRD without these is incomplete. The team that ships without them is shipping with a hidden Day-180 problem.
The data-prep tax
Most AI PRD failures attribute slippage to scope creep, model issues, or unexpected complexity. The honest postmortem usually surfaces a different cause: the data wasn't ready, and the team underbudgeted the prep work.
Industry research is consistent: data preparation accounts for 20–40% of total AI project cost. The work includes:
- Cleaning (removing duplicates, fixing format inconsistencies, handling nulls)
- Deduplication and canonicalization
- Sensitive-information scrubbing (PII, PHI, IP, customer data)
- Schema normalization and field mapping
- Label quality (golden datasets from AI Evals L1-T05)
- Ongoing freshness (production data drifts; the dataset that worked at launch goes stale)
The fix is to budget data prep explicitly — typically 20–40% of project time, with a dedicated owner and acceptance criteria. The PRD names the data-prep workstream, the owner, and the deliverables. Skipping this step is the single most common cause of AI launch slip.
DeepSeek V3.2 and the model-routing pattern
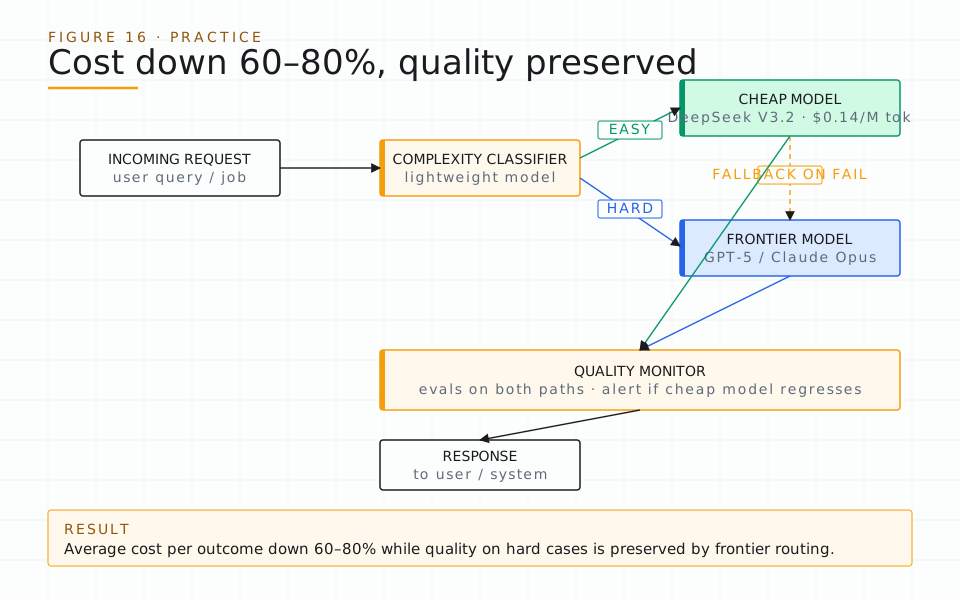
DeepSeek V3.2 at $0.14/M tokens — 95% cheaper than the frontier — is the most consequential pricing event of 2026 for cost-per-completed-job optimization. The pattern: route low-complexity work to a cheap model; reserve frontier capability for the hard 10–20%.
The implementation:
- A complexity classifier (often a small fast model itself) sorts incoming requests by complexity.
- Routine requests go to a cheap model. Quality is monitored on a sample.
- Complex requests go to a frontier model. Quality is monitored on every output.
- Failures on the cheap model can fall back to the frontier model with the original input.
A team running this pattern can drop average cost per completed job by 60–80% while preserving quality on the hard cases that matter. The savings are large enough to absorb significant token-tsunami growth from L1-T07, which owns cost per completed job as the core unit.
The L3-T03 chapter on multi-model orchestration is the deeper playbook. The pattern is the single highest-leverage cost lever for most enterprise AI products, and it's invisible to teams that aren't measuring cost per completed job at the routing level.
Where this hits in production
The CFO conversation changes shape. Without Day-1 cost discipline, the conversation is reactive: "why did the AI bill triple?" With Day-1 cost discipline, the conversation is proactive: "here are the cost-per-completed-job trends, here's what's driving variance, here's the response plan." The PM moves from defending the AI initiative to leading the financial conversation about it.
The pricing team gets a usable input. Pricing decisions need cost data. Without instrumented per-outcome cost, pricing is guessing. With it, pricing has a basis. The Day-1 cost discipline is what makes the L2-T04 pricing taxonomy operational.
The eval flywheel becomes a cost lever. The Eval Flywheel (AI Evals L3-T24) catches quality regressions and adds them to the dataset. The flywheel can also catch cost regressions — the moment a feature change increases cost per completed job — and trigger a response. Cost-aware flywheels keep the unit economics healthy as the product evolves.
The Cursor lesson is the public reference for what skipping this discipline costs. The team's pricing didn't track cost per completed job. The cost cliff hit. The fix required harness re-engineering plus pricing redesign together. Both could have been planned in advance with Day-1 cost discipline. Neither was, because cost wasn't on the PRD.
The trap
Trap 1: Treating cost as engineering's job. The mismatch is structural: engineering optimizes for the metrics they're measured on. Without cost on the product team's dashboard, engineering optimizes for accuracy and latency. The team ships a feature that's accurate, fast, and unprofitable.
Trap 2: Estimating instead of instrumenting. Estimated cost is wrong by 2–10× in either direction. Instrumented cost — actual model spend, actual retrieval calls, actual tool invocations attributed per outcome — is the only reliable input. The discipline is to instrument from Day 1, even if the early data is noisy.
Trap 3: Aggregating cost across users without distribution awareness. Average cost hides the P90 (see L1-T07, which owns cost per completed job). The dashboard reports "$2 per user" while the P90 cohort costs $80. The fix is to dashboard the distribution, not the average.
Trap 4: Skipping the data-prep budget. "We'll use the existing data" is the most common cause of AI launch slip. Industry data shows 20–40% of project cost is data prep. PRDs that skip this line slip every time.
Remember this
- AI Cost per Output goes on every PRD from Day 1. The metric pairs with engagement on every dashboard. Without it, the team is flying blind on unit economics.
- Data prep is 20–40% of project cost. Budget it explicitly. Name an owner. Skipping the data-prep budget is the most common cause of AI launch slip.
- DeepSeek V3.2 at $0.14/M tokens reframes the cost case. Model routing — cheap for routine, frontier for hard — drops average cost per completed job 60–80% while preserving quality.
- Five things on every AI PRD: cost-per-completed-job target, cost components, data-prep budget, cost-instrumentation plan, cost-response triggers.
- Cost is a product metric, not an engineering chore. The team that doesn't dashboard cost on the product side ships features that are accurate, fast, and unprofitable.
In practice
Step 1: Build the cost-per-completed-job PRD template. Five sections: target (P50 and P90 numbers), components (model + retrieval + tools + judges + infra + data prep), data-prep budget (% allocation, owner, deliverables), instrumentation plan (which traces, which dashboards, who reviews), response triggers (what happens at +25% / +50% over target).
Step 2: Instrument cost from Day 1. Every trace tags model used, tokens consumed, tool calls made, judge calls, retrieval calls. Cost dashboards show P10/P50/P90/P99 distributions. Engagement and cost are paired on every chart.
Step 3: Implement model routing. Complexity classifier on the front. Cheap model (DeepSeek, Llama, Phi-4) for routine. Frontier for the hard 10–20%. Quality monitoring on both paths. Fallback rules for cheap-model failures.
Step 4: Add cost regressions to the eval flywheel. Cost increases per outcome are a regression class. Promote into the eval suite. CI gates on cost. Production monitoring on cost. The flywheel keeps cost healthy as the product evolves.
Step 5: Run a quarterly cost-per-completed-job review with finance. Same cadence as the harness-metric review (L1-T01) and the CAPTURE retrospective (L1-T06). The finance partner is co-author of the report, not the recipient.
The practice — visualized
References
- What decision does the cost contract change?
- What evidence — instrumented, not estimated — would change the cost target?
- What does the PRD still not prove about cost at heavy use?